Intro
Here at TaskRabbit, we have relied on ElasticSearch for over a year now. We started using it as log storage of all the events flowing though our resque-bus, as ElasticSearch is a great distributed storage tool. We create an index for each month (~20GB) and we can scan/search for anything we need. Then, we started using ElasticSearch for, you know, search. We once again used resque-bus to populate all Taskers and Tasks into their respective indexes and it worked exactly as intended. Next, we started using ElasticSearch to populate recommendations to Taskers about open tasks they might want to do. We created a more complex search query matching their interests and past tasks with what was available in the marketplace.

Then, we did the same for Clients!

When we made the switch to the New TaskRabbit this summer, we started relying on ElasticSearch even more heavily. When you search for a Tasker to help you, our algorithm relies very heavily on ElasticSearch. There is a document for each Tasker which contains all the relevant info needed, which is hit with every query.

These changes reflect a consistent increase in the load we have applied to ElasicSearch over the past year… and eventually we pushed it to the limit 😦 For the first few days of the New TaskRabbit, we had at least one catastrophic ElasitcSearch crash each day. ElasticSearch is now in the path to posting a task, it is very important for us to keep it running.
This is the chronicle of how we debugged ElasticSearch and got it working again!
Treat it like a DB
First, we needed to make the mental shift about how we were thinking about ElasticEarch. In the old TaskRabbit, ElasticSearch could go down, and you could still hire people. This is no longer the case. More interestingly, in the old system ElasticSearch was not a primary store for any data, and we could always repopulate it with rake jobs. Now, we had 3 tiers of ElasticSearch data: Primary Storage, Search Cache, and Logs. The "Search Cache" data can still be rebuilt and the site still works if we lose our logs, but ElasticSearch had become the primary storage engine for communications between Taskers and Clients. This means that ElasticSearch is now as important to TaskRabbit as the mySQL cluster.
In order to handle this shift, we did a few things. First, we needed a tool to backup this index periodically. We really wanted a tool like mysqldump for ElasticSearch, but there wasn’t one… so we made ElasticDump. We use this tool to snapshot the index, gzip the JSON, and store it off line. We can also use the same tool to load the data into out staging environment to debug problems with production data.
Finally, we made sure that the rake jobs we use to repopulate the search indexes are as fast as possible. Rather than one rake job to load everything in (which would take days), we once again relied on resque-bus to fan out the loading process to as many worker nodes as possible. This allows us to load in all the data we need in only a few hours (in the case of catastrophic failure).
GeoJSON and CPU
One of the most CPU intensive operations we have seen within ElasticSearch is the loading of a new GeoJSON shape. Every TaskRabbit Tasker draws a map of where they want to work, and the parsing of these shapes (and the metros of every city) is very CPU intensive. We learned that the default precision of 5m for every cell in a geohash was simply too detailed for our needs. Changing this mapping made our indexing speed orders of magnitude faster.
The JVM and You
ElasticSearch runs on Java, and tuning the JVM’s memory management is something that every operations engineer has do in their career… and it is never easy. We were victims of a very long and painful garbage collection cycle, and it took us a while to learn how to resolve it. All we noticed at first was that for about 5 minutes, all data nodes in our ElasticSearch cluster would fail every few hours. Step 1 was to get better logging.
ElasticSearch has a slowQuery log you can enable in elasticsearch.yml:
index.search.slowlog.threshold.query.warn: 10s
index.search.slowlog.threshold.query.info: 5s
index.search.slowlog.threshold.query.debug: 2s
index.search.slowlog.threshold.query.trace: 500ms

index.search.slowlog.threshold.fetch.warn: 1s
index.search.slowlog.threshold.fetch.info: 800ms
index.search.slowlog.threshold.fetch.debug: 500ms
index.search.slowlog.threshold.fetch.trace: 200ms

index.indexing.slowlog.threshold.index.warn: 10s
index.indexing.slowlog.threshold.index.info: 5s
index.indexing.slowlog.threshold.index.debug: 2s
index.indexing.slowlog.threshold.index.trace: 500msEnabling this showed us that in the downtime windows, we were still serving queries, but they were taking seconds to complete where normally they take milliseconds. Correlating that with the normal logs, we learned that these slower queries were blocking later queries from being parsed, and they were simply being rejected:
...
Caused by: org.elasticsearch.common.util.concurrent.EsRejectedExecutionException: rejected execution **(**queue capacity 1000**)** on org.elasticsearch.transport.netty.MessageChannelHandler$RequestHandler
...This indicates that we had a cascade failure! If one node slows down, requests would be routed to the next one, and compound the problem.
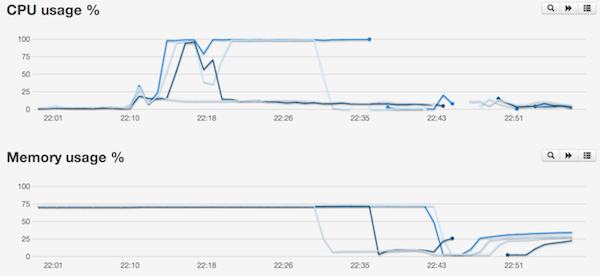
Naively, we thought we simply had a throughput problem. We changed our ElasticSearch nodes over to larger hosts, greatly increasing the amount of RAM and CPU available. This however, made the problem worse. While it took longer for our failures to occur from a cold-boot, we went from 5 minutes of downtime to 15! Our system monitoring showed us that the host was never out of ram, but during these outages we were pegging the CPU at 100%. What was going on?
ElasticSearch will note in its normal logs if any GC is happening which effects a slow query, but we wanted more detail. Another logging option ElasticSearch has is ES_USE_GC_LOGGING which sets some JVM variables:
# from elasticsearch.in.sh.erb
if [ "x$ES_USE_GC_LOGGING" != "x" ]; then
  JAVA_OPTS="$JAVA_OPTS -XX:+PrintGCDetails"
  JAVA_OPTS="$JAVA_OPTS -XX:+PrintGCTimeStamps"
  JAVA_OPTS="$JAVA_OPTS -XX:+PrintClassHistogram"
  JAVA_OPTS="$JAVA_OPTS -XX:+PrintTenuringDistribution"
  JAVA_OPTS="$JAVA_OPTS -XX:+PrintGCApplicationStoppedTime"
  JAVA_OPTS="$JAVA_OPTS -Xloggc:/var/log/elasticsearch/gc.log"
fiWith these options enabled, a new log file will be created which will log the occurrences and durations of each GC event. We confirmed that ElasticSearch was in fact garbage collecting for large amounts of time… and with more ram, it took longer when something went wrong. The JVM (unlike ruby) is good at obeying its min and max allocation, so the system ram was never overloaded, which was what we were used to looking for as a problem signal. The ES_HEAP_SIZE environment variable is used for this purpose. You can modify it within /etc/init.d/elasticsearch on Ubuntu.
To fix the long garbage collection time, we switched from openJDK to Oracle’s "official" Java branch. We also switched to the G1GC garbage collector from the default ConcMarkSweepGC method. To change this, you will need to modify bin/elasticsearch.in.sh, as the older options are hard-coded:
...
# JAVA_OPTS="$JAVA_OPTS -XX:+UseParNewGC"
# JAVA_OPTS="$JAVA_OPTS -XX:+UseConcMarkSweepGC"

# JAVA_OPTS="$JAVA_OPTS -XX:CMSInitiatingOccupancyFraction=75"
# JAVA_OPTS="$JAVA_OPTS -XX:+UseCMSInitiatingOccupancyOnly"

# Try new GC
JAVA_OPTS="$JAVA_OPTS -XX:+UseG1GC"
...Depending on your OS, you may also need to modify /etc/init.d/elasticsearch to point to the proper version of the Java binary.