This post is a continuation to my previous post, Elasticsearch in Production. It has been a few months since we became heavy elasticsearch production users, and this is the first time that I feel our cluster is stable. It has been a long road for us, which included creating tools like ElasticDump and Waistband, a number of version changes, and custom integrations, but we are finally there! With that in mind, here is the up-to-date list of what we did/learned to stabilize the TaskRabbit Elasticsearch cluster.
Treat it Like a Database (again)
This mental shift is still the most important thing. You need backups (we use the AWS elasticsearch plugin to make nightly snapshots to S3), you need import/export tools (why we made ElasticDump), and you need good monitoring. 2 new plugins we have recently installed are elasticsearch-HQ and Whatson.
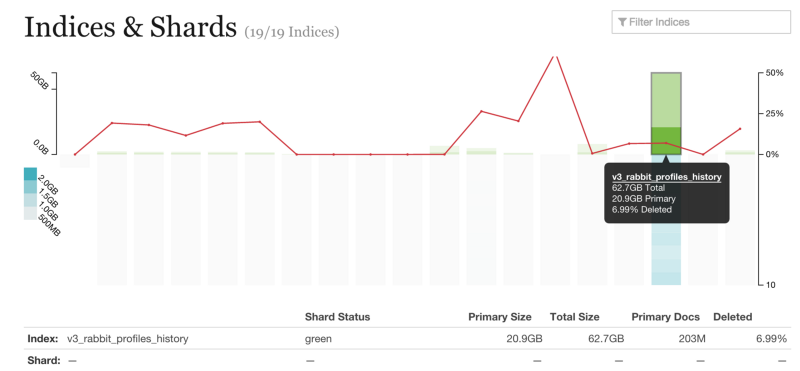
Whatson helps you visualize the commit state of your Lucene indexes. We learned via this tool that some of our indexes are constantly being written to, and thus we usually have a long delay before data is committed to disk.
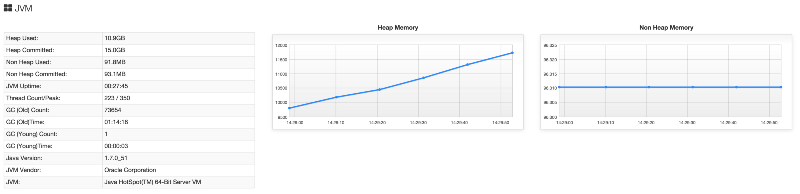
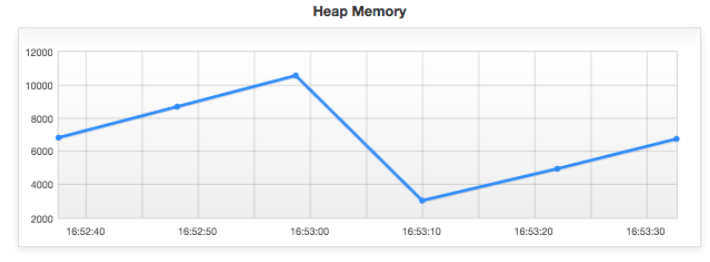
elasticsearch-HQ offers a ton of great features, but one of the most useful for us was the Heap and JVM visualizers. One of the ways we identified a bad query (discussed more below) was by noticing how fast our heap utilization was growing. We knew we had solved the bug when the heap growth velocity went down 3x.
Data Durability
Elasticsearch is the source-of-truth for some of our data. We had experienced failure scenarios where nodes a cluster failure caused significant data loss. This is not good! Here is an example:
- Cluster has 3 data nodes, A, B, and C. The index has 10 shards. The index has a replica count of 1, so A is the master and B is a replica. C is doing nothing. Re-allocation of indexes/shards is enabled.
- A crashes. B takes over as master, and then starts transferring data to C as a new replica.
- B crashes. C is now master with an impartial dataset.
- There is a write to the index.
- A and B finally reboot, and they are told that they are now stale (as C had a write while they were away). Both A and B delete their local data. A is chosen to be the new replica and re-sync from C.
- … all the data A and B had which C never got is lost forever.
While Elasticsearch’s data sharding is awesome, we have learned that for truly important data, we need to increase the replication count so that ALL nodes in the cluster contain the data. This way, you can recover from any number of lost nodes, and any node in the cluster can start a new cluster in a catastrophic failure.
You can learn more about this from the excellent "call me maybe" post series which tests the recovery and partition tolerances of a few common database tools.
Keep your versions up to date!
This goes without saying, but the Elasticsearch team is constantly making improvements. There are always significant performance improvements each release. There is no reason not to update/upgrade, especially because yo can do a 0-downtime rolling update with Elasticsearch.
One of the new features in 1.4.x is the ability to upgrade your Lucence indexes in-line. You can learn more here
Virtualization and CPU binding
Along with the rule that Elasticsearch should never use more than 49% of the system’s available RAM (and you should enable memlockall if your OS supports it), you should also never over-commit your system’s CPUs.
One of the mistakes I made while debugging our cluster was attempting to allocate more CPU resources to the elasticsearch Virtual Machines, as we had learned that the number of CPUs is related to the number of open indexes (to remain performant). While true, I foolishly created 32-core VMs on physical servers which only had 16 CPUs. While this worked OK most of the time, when elasticsearch was garbage collecting (a very CPU-intensive operation) the VM would grind to a halt because there was so much overhead needed by VMware to visualize more CPUs than it actually had available.
Oops.
Geographic Resolution.
One of the big improvements we made was adjusting the resolution of geographic fields. TaskRabbit uses elasticsearch for a lot of geography searching (ie: which Taskers are available tomorrow within SOMA to help me with my Task?). When you import a geographic region into elasticsearch, it "rasterizes" the data so it can be searched more efficiently. However, the resolution of each of those "raster regions" is up to you. We only need data at the "city block" level of resolution, so we were able to reduce the index size of our geographic indexes from the default level by 1/2. This required a lot less ram to keep that data "hot" and also sped up queries!
Wildcards
We learned that Wildcard Queries could be expensive, and should be avoided whenever possible. Think about select * where col=x… in SQL vs select * from table where col LIKE x…. LIKE requires to scan all the rows (and sometimes all of the columns)! A wildcard is very similar.
We had been using a wildcard query over a small collection of data… or so we thought. While the number of items in the index were only in the few thousands, the width of each element was huge. This meant that Elasticsearch needed to load the whole record into ram to parse it. This was what caused the huge Heap growth (and decay) I mentioned earlier.
Don’t use wildcards in your queries.
The JVM and You
We still tune our JVM as we had talked about in our last post. We are still using the Oracle version of Java and the new GC1 Garbage Collector via JAVA_OPTS="$JAVA_OPTS -XX:+UseG1GC" There as a big improvement in stability with Oracale’s JVM over OpenJDK, and we have seen no problems with the "unsupported", faster GC.
See the previous post for more information.
What didn’t work
Bulk updates. When you write a document to Elasticsearch, it is first added to the index, and then eventually indexed so it will appear in search, and this process happens asynchronously from the write. The bulk APIs allow you to pause the indexer while you write a large number of documents, and turn it on when you are done. This is supposed to allow you to save CPU cycles and allow you to have a searchable snapshot of data that won’t change while you are applying updates (almost like a commit in SQL terms).
However, in our case, after we wrote our bulk data and re-enabled indexing, the CPU required to index the new data drastically slowed down all other operations in the cluster. We ended up keeping our "bulk updates" as many individual writes. While this has the properly of slowing down each write, we end up keep the whole cluster more stable.
What’s next?
Nginx. We are going to start proxying all Elasticsearch HTTP requests though nginx. This way, we can use the nginx logs to have a record of what queries and params we are using, and how long they take. This data in aggregate is a far better way to look for and analyze slow queries. We use Sumologic for this purpose. Down the road, this will also allow us to restrict certain routes and verbs to authenticated users (like DELETE / for instance).
Waistband Permissions. While Elasticsearch itself doesn’t have users or permissions (yet), we can emulate some of this behavior in our client library. We can set rules so that a given application or connection won’t be allowed to issue PUT or DELETE requests to the cluster. This will add a level of security to our development we didn’t have before.
Parent-child data separation. As mentioned above, we still have large bulk updates. However, the majority of this data doesn’t change frequently. We can separate out what is essentially one wide table into a few smaller parent/child tables. This will make the data volume we write smaller, which in turn will speed up indexing.
Closing Thoughts
- I want to thank Doc for spending time with us and helping us debug our cluster.
- The Elasticsearch mailing list is a great resource. The community is very friendly and welcoming. You should subscribe to the daily digest and browse the headlines… you will certainly see something relevant to your interests within a week.