We recently found & solved a memory leak in ActionHero. If you use ActionHero to serve static assets, you should see a significant memory reduction with long-running servers. Yay!
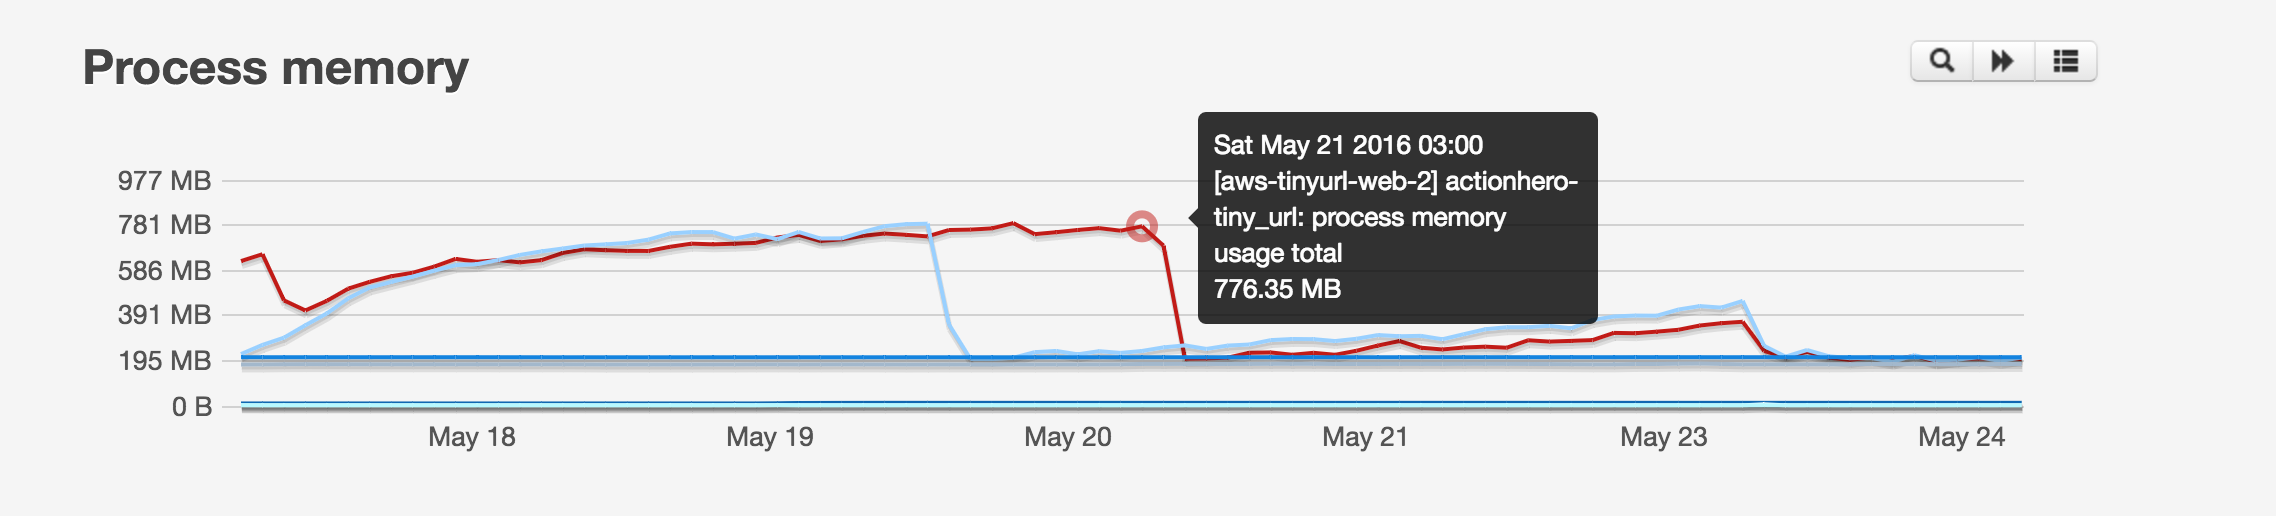
This leak was discovered by the TaskRabbit team when one of their micro-services kept restarting every few days. TaskRabbit uses monit to run all of their applications, and when an app uses too much RAM, it will HUP the app (preforming a graceful restart) and notify the team via PagerDuty:
# managed by ansible

CHECK PROCESS actionhero-{{ application }}

  WITH PIDFILE /home/{{ deploy_user }}/www/{{ application }}/shared/pids/cluster_pidfile

  START PROGRAM "/bin/bash -c 'source /home/deploy/.profile && cd /home/{{ deploy_user }}/www/{{ application }}/current && HOME=/home/{{ deploy_user }} ./node_modules/.bin/actionhero start cluster --daemon --workers={{ actionhero_workers }}'"
    as uid {{ deploy_user }}
    with timeout 30 seconds

  STOP PROGRAM "/bin/bash -c 'kill `cat /home/{{ deploy_user }}/www/{{ application }}/shared/pids/cluster_pidfile`'"
    as uid {{ deploy_user }}

  if mem is greater than 600 MB for 5 cycles
    then exec "/bin/bash -c 'kill -s USR2 cat `cat /home/{{ deploy_user }}/www/{{ application }}/shared/pids/cluster_pidfile`'"

  if totalmemory is greater than 800 MB for 10 cycles
    then exec "/bin/bash -c 'kill -s USR2 cat `cat /home/{{ deploy_user }}/www/{{ application }}/shared/pids/cluster_pidfile`'"

  if mem is greater than 600 MB for 5 cycles
    then alert
  else if passed for 3 cycles
    then alert

  if totalmemory is greater than 800 MB for 10 cycles
    then alert
  else if passed for 3 cycles
    then alert

  if cpu is greater than 25% for 20 cycles
    then alert
  else if passed for 3 cycles
    then alert

  if totalcpu is greater than 90% for 10 cycles
    then alert
  else if passed for 3 cycles
    then alert

  if uptime < 1 minutes for 3 cycles
    then alert
  else if passed for 3 cycles
then alert- Note that in Ansible, the `` variables are interpolated, and won’t be there in the final file
So what was happening here? This application had previously never served any static files, and was an API endpoint (which runs tr.co). Now, with the introduction of Universal Links in IOS, we are also serving up the typical apple-app-site-association file. To support multiple environments, we actually use an action to serve this file, and return the proper one:
exports.action = {
  name: "apple-app-site-association",
  description: "I return the wacky payload apple needs",

  run: function (api, data, next) {
    data.connection.sendFile("apple-app-site-association/" + api.env + ".json");
    data.toRender = false;
    next();
  },
};exports.default = {
routes: function (api) {
return {
all: [
{
path: "/apple-app-site-association",
action: "apple-app-site-association",
},
],
};
},
};… and it works fine. However, the only change the application underwent which triggered the memory leak was this action… so there has to be something wrong here.
After scouring the application itself with node-debugger, nothing looked out-of-wack, but adding in a load-test, the problem was certainly reproducible. From there I dove into actionhero’s core and sure enough, sending lots of files, either though the static server or `data.connection.sendFile()` caused a leak 😦
After digging around deep in ActionHero’s guts, I narrowed down the problem to the fact that there was an ever-growing number of HTTP connections (an internal object to ActionHero which represents the state of a request) that just never completed. Less than 1% of the connections have this problem, but over time, it would be enough to cause the leak. I decided to see if I could reproduce the problem from scratch, in a simple, 1-file node app… and here is the result:
var fs = require("fs");
var http = require("http");
var file = __dirname + "/index.html";
var connections = {};
var idCouner = 0;
var port = 8080;

var handleRequset = function (request, response) {
  idCouner++;
  var id = idCouner;
  connections[id] = { req: request, res: response };

  response.on("finish", function () {
    delete connections[id];
  });

  fs.stat(file, function (error, stats) {
    if (error) {
      throw error;
    }
    response.writeHead(200, [["Content-Length", stats.size]]);

    var fileStream = fs.createReadStream(file);
    fileStream.on("open", function () {
      fileStream.pipe(response);
    });

    fileStream.on("error", function (error) {
      console.log(error); // no errors are caught
    });
  });
};

http.createServer(handleRequset).listen(port);

console.log("server running on port " + port);
setInterval(function () {
  console.log("connections: " + Object.keys(connections));
}, 5000);If you were to run this server, and use the loadtest module against the server:
npm install loadtest

./node_modules/.bin/loadtest -c 10 — rps 200 http://localhost:8080You would get a result that a small amount of connection objects are hanging around and never resolved:
> node server.js

server running on port 8080
connections:
connections: 2867
connections: 2867
connections: 2867
connections: 2867
connections: 2867
connections: 2867
connections: 2867
connections: 2867
connections: 2867
connections: 2867,12403
connections: 2867,12403
connections: 2867,12403
connections: 2867,12403
connections: 2867,12403
connections: 2867,12403
connections: 2867,12403
connections: 2867,12403
connections: 2867,12403
connections: 2867,12403
connections: 2867,12403,22350
connections: 2867,12403,22350… and there’s our leak!
Now to figure out why.
After struggling with this for a few days, I threw up my hands and decided this might be a bug in node.js’ core, and created an issue https://github.com/nodejs/node/issues/6929. Luckily, some helpful folks were able to point out my error.
I had been testing for all sorts errors with the file stream… but I was forgetting about errors which might happen with the HTTP connection. If an http connection completes happily, it emits the `finish` event. However, if a response object is prematurely closed (perhaps the client disconnects, has networking trouble, etc), the response object will emit the `close` event instead… an event we were ignoring! This certainly correlates with the behavior we were seeing… a small number of requests might have trouble, disconnect… and ActionHero would never free that connection object.
The relevant sections of ActionHero were fixed in version 13.4.1, and now our connection logic for sending files via HTTP looks like:
// the ‘finish’ event denotes a successful transfer
connection.rawConnection.res.on("finish", function () {
  connection.destroy();
});

// the ‘close’ event denotes a failed transfer, but it is probably the client’s fault
connection.rawConnection.res.on("close", function () {
  connection.destroy();
});